See the indicator in action on real charts
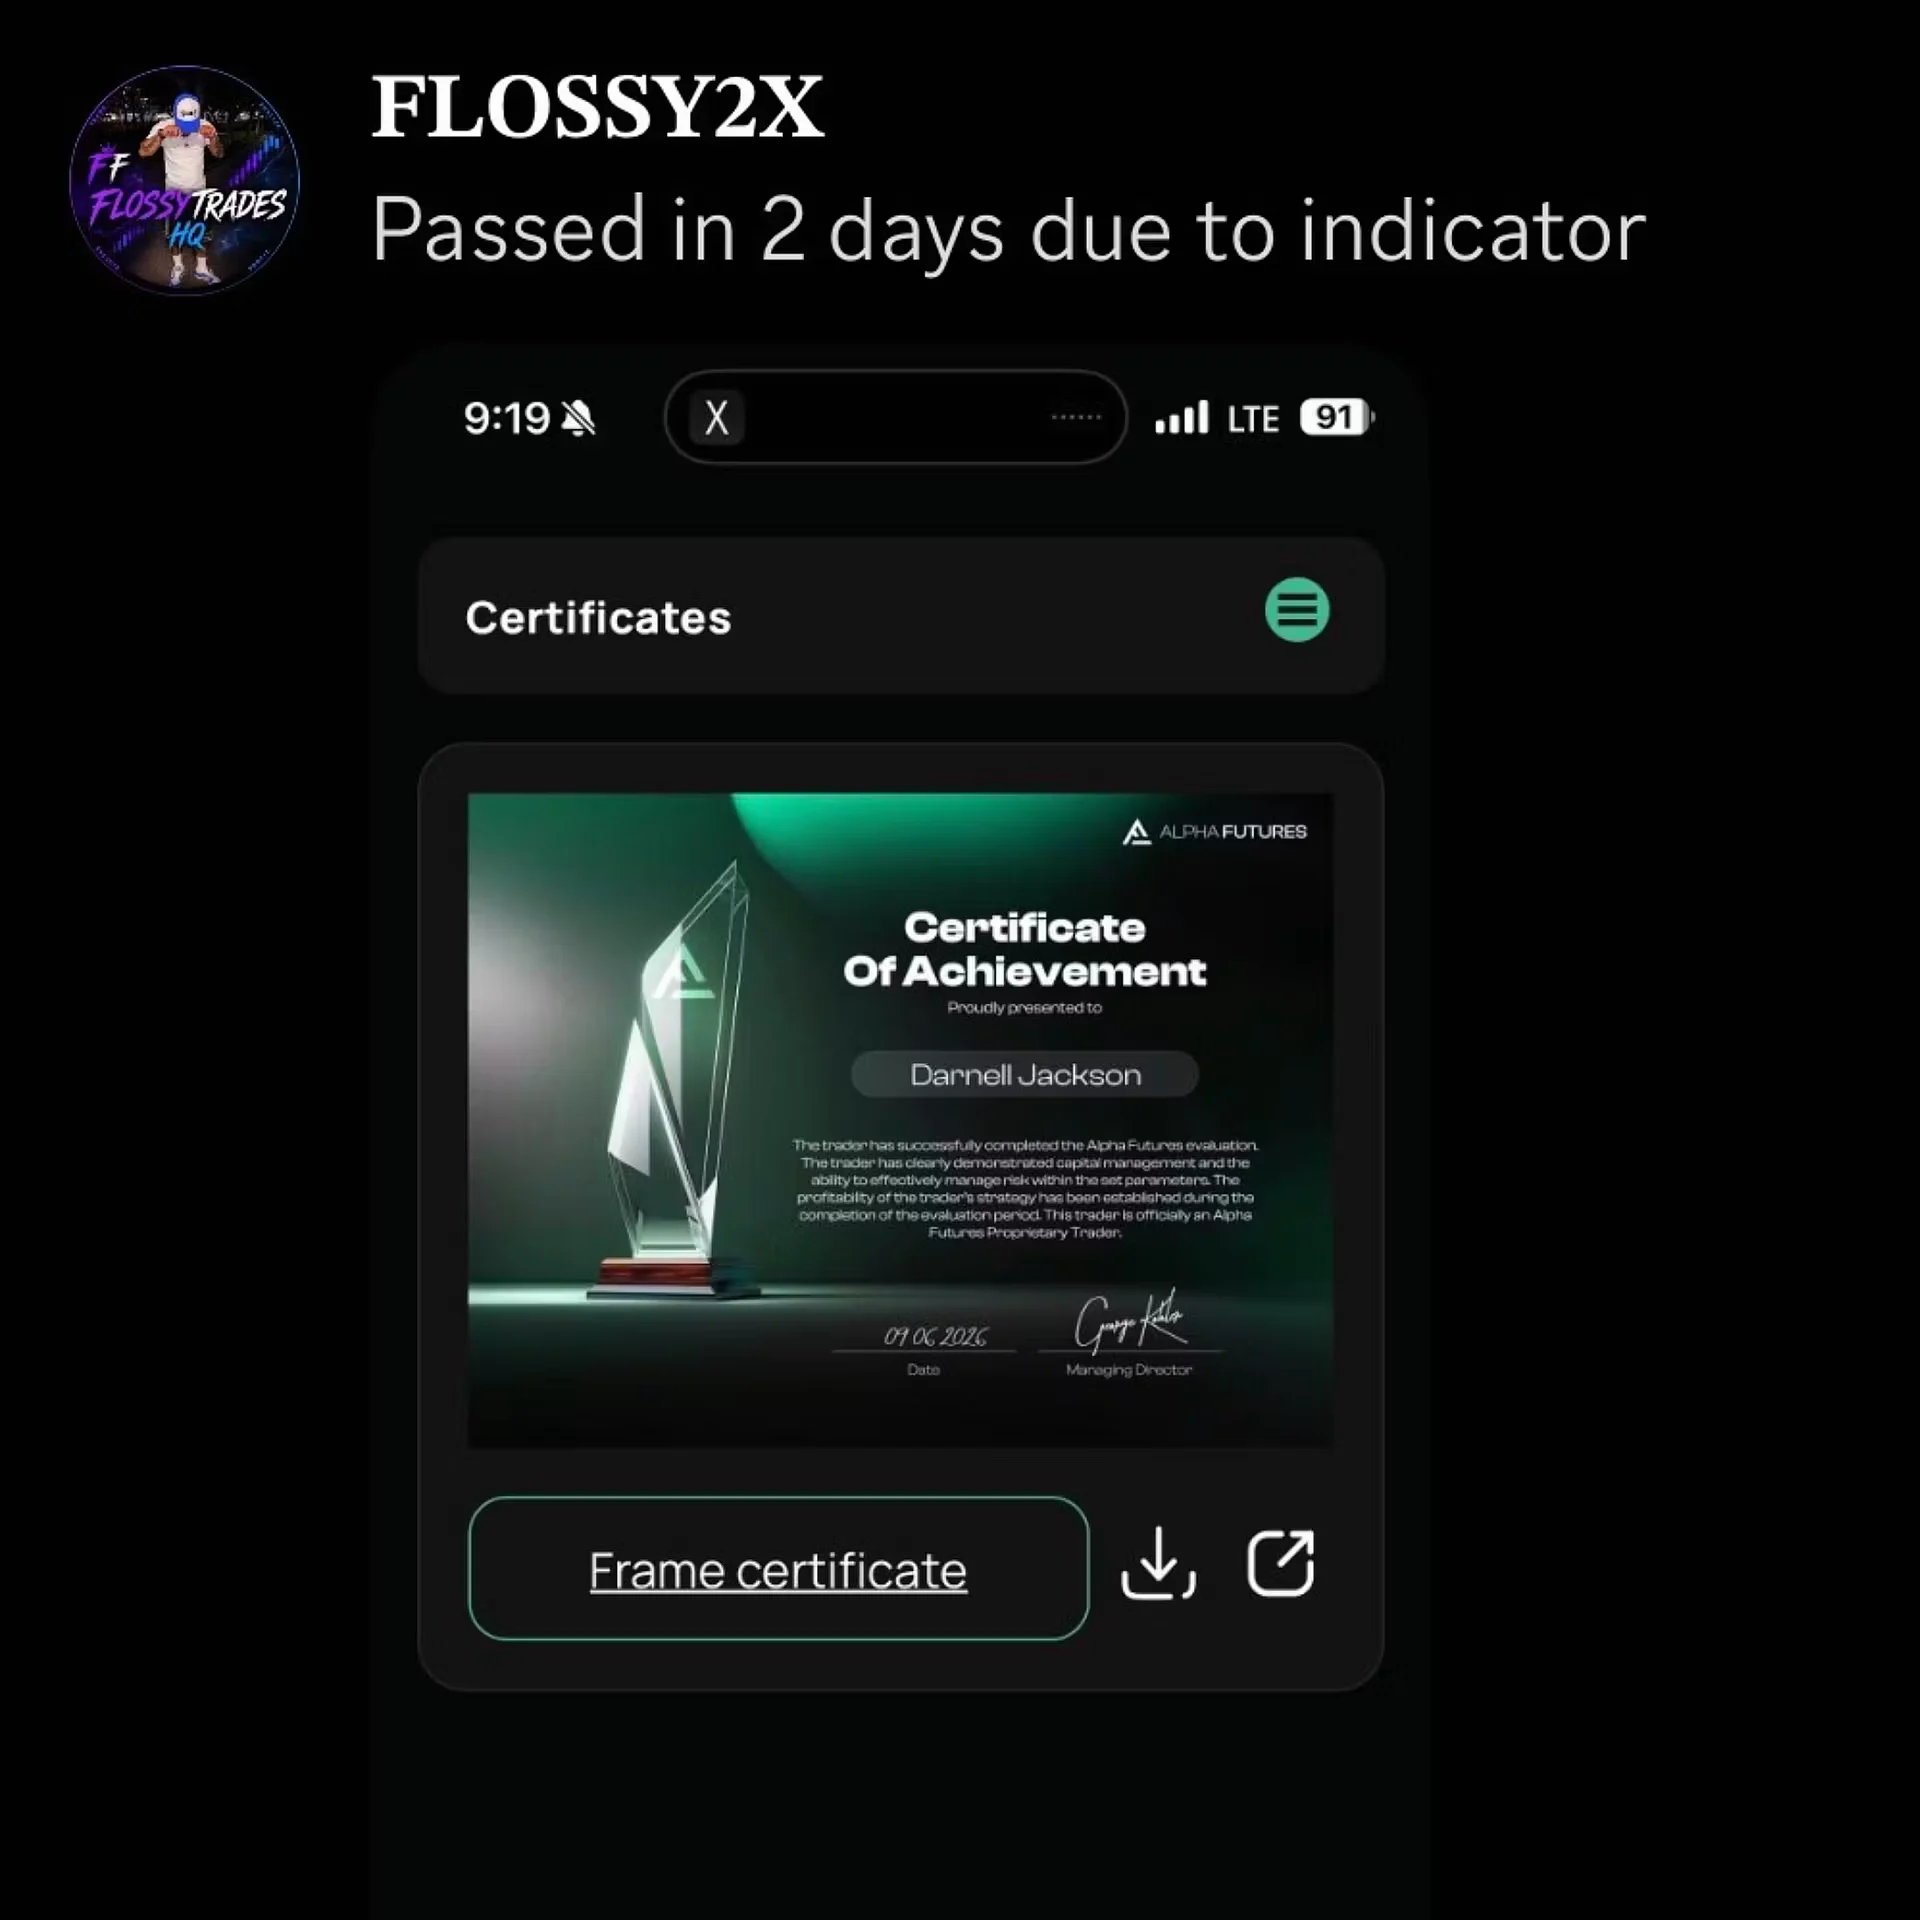
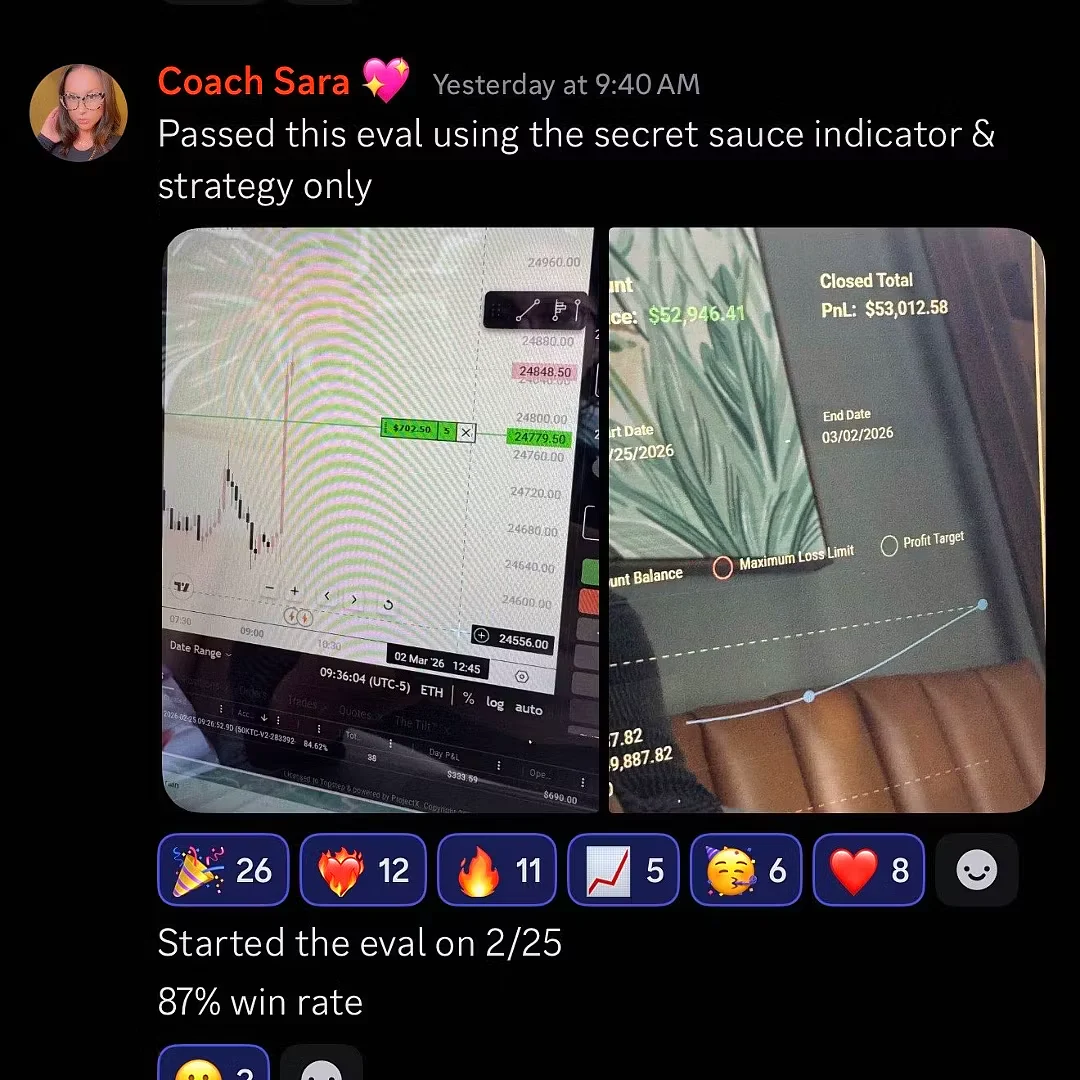
Screenshots shared by traders using the indicator, from chart examples to their feedback after putting it to work.
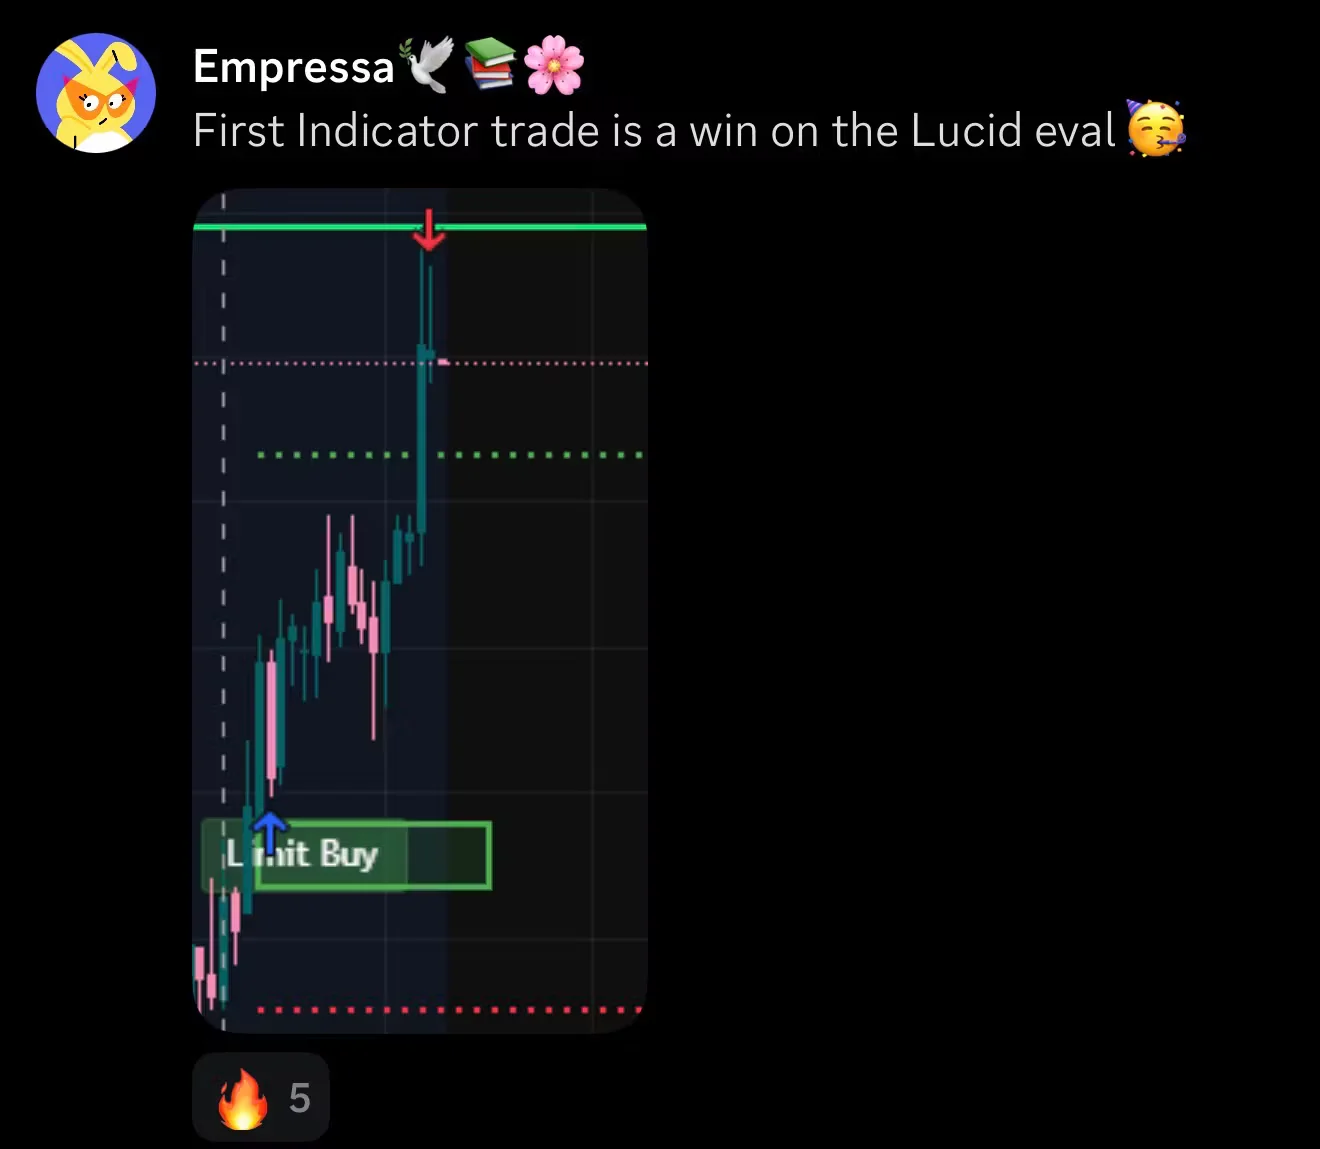
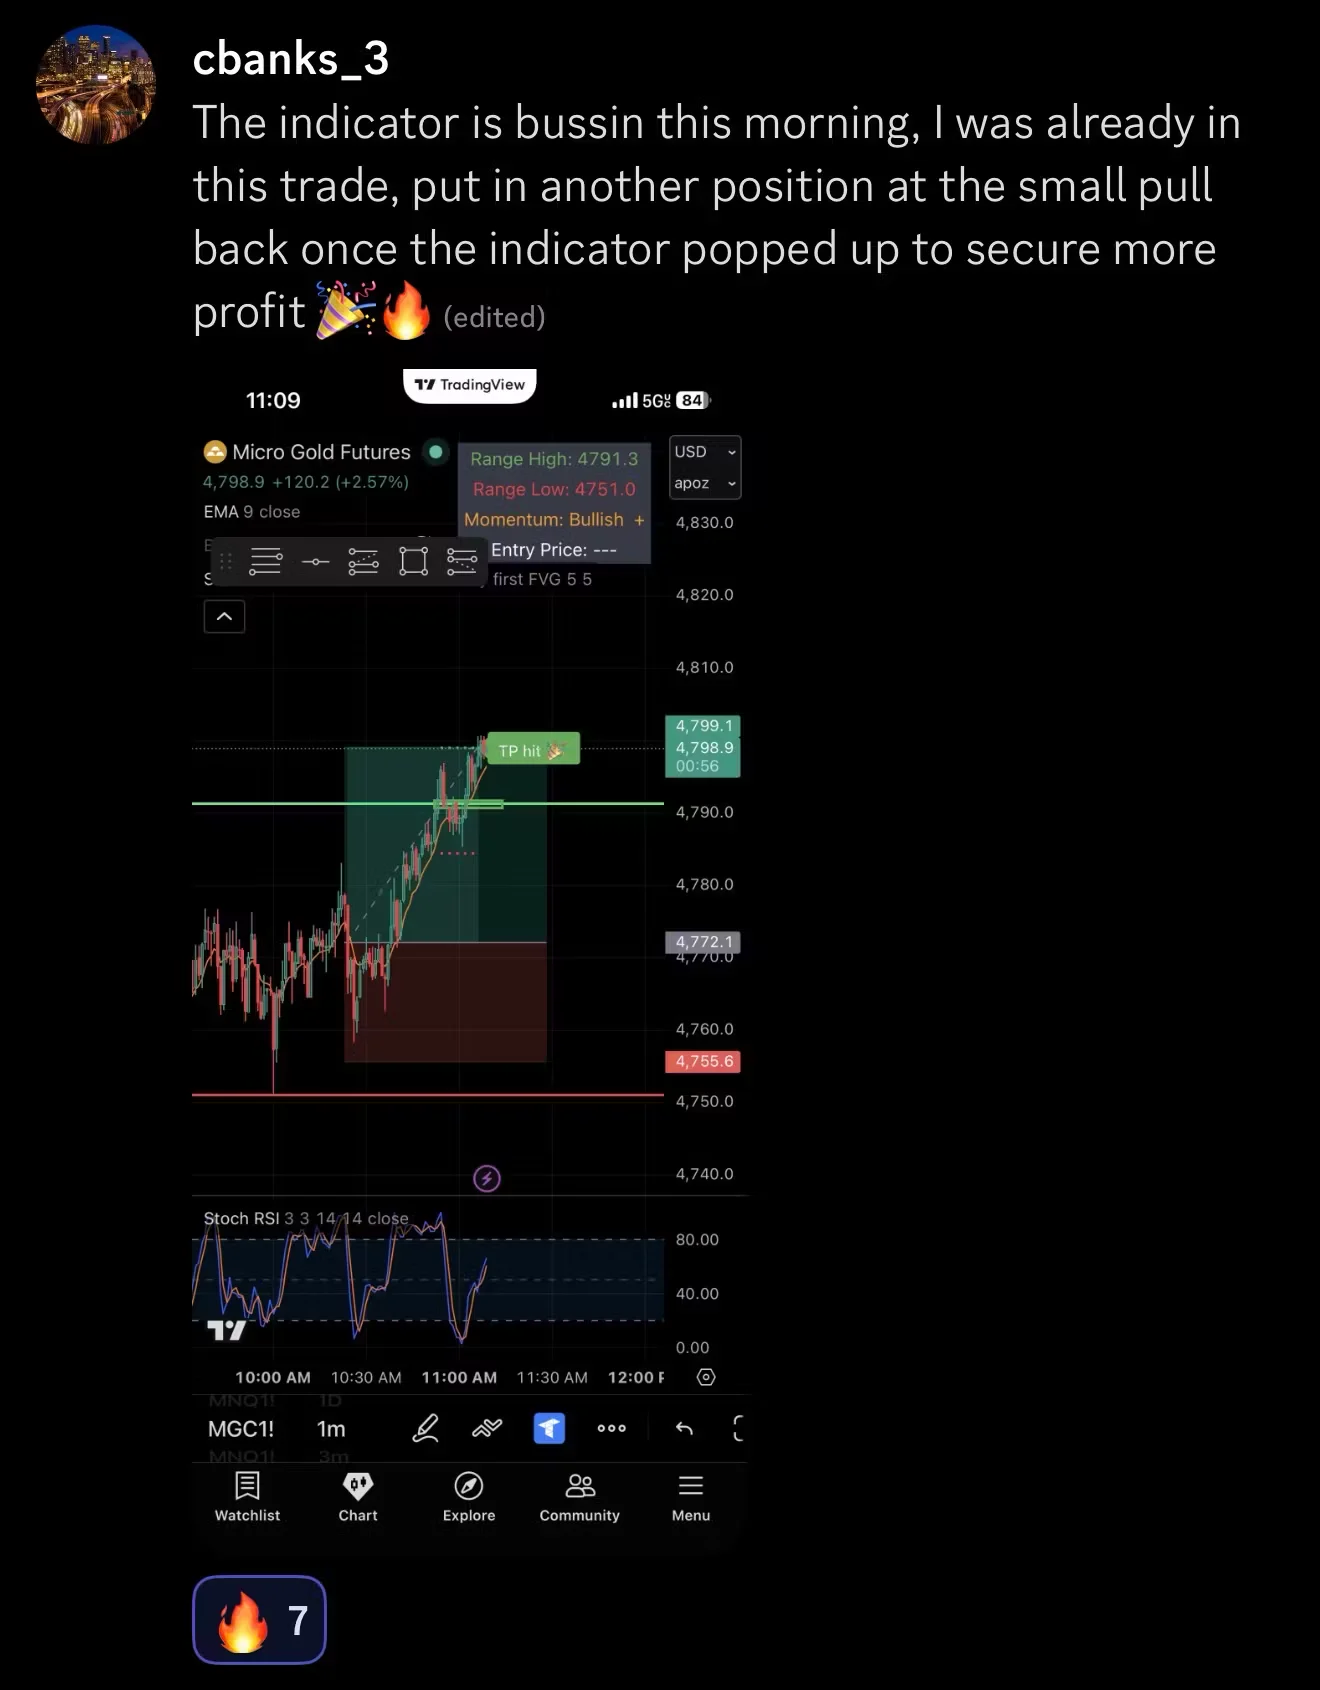
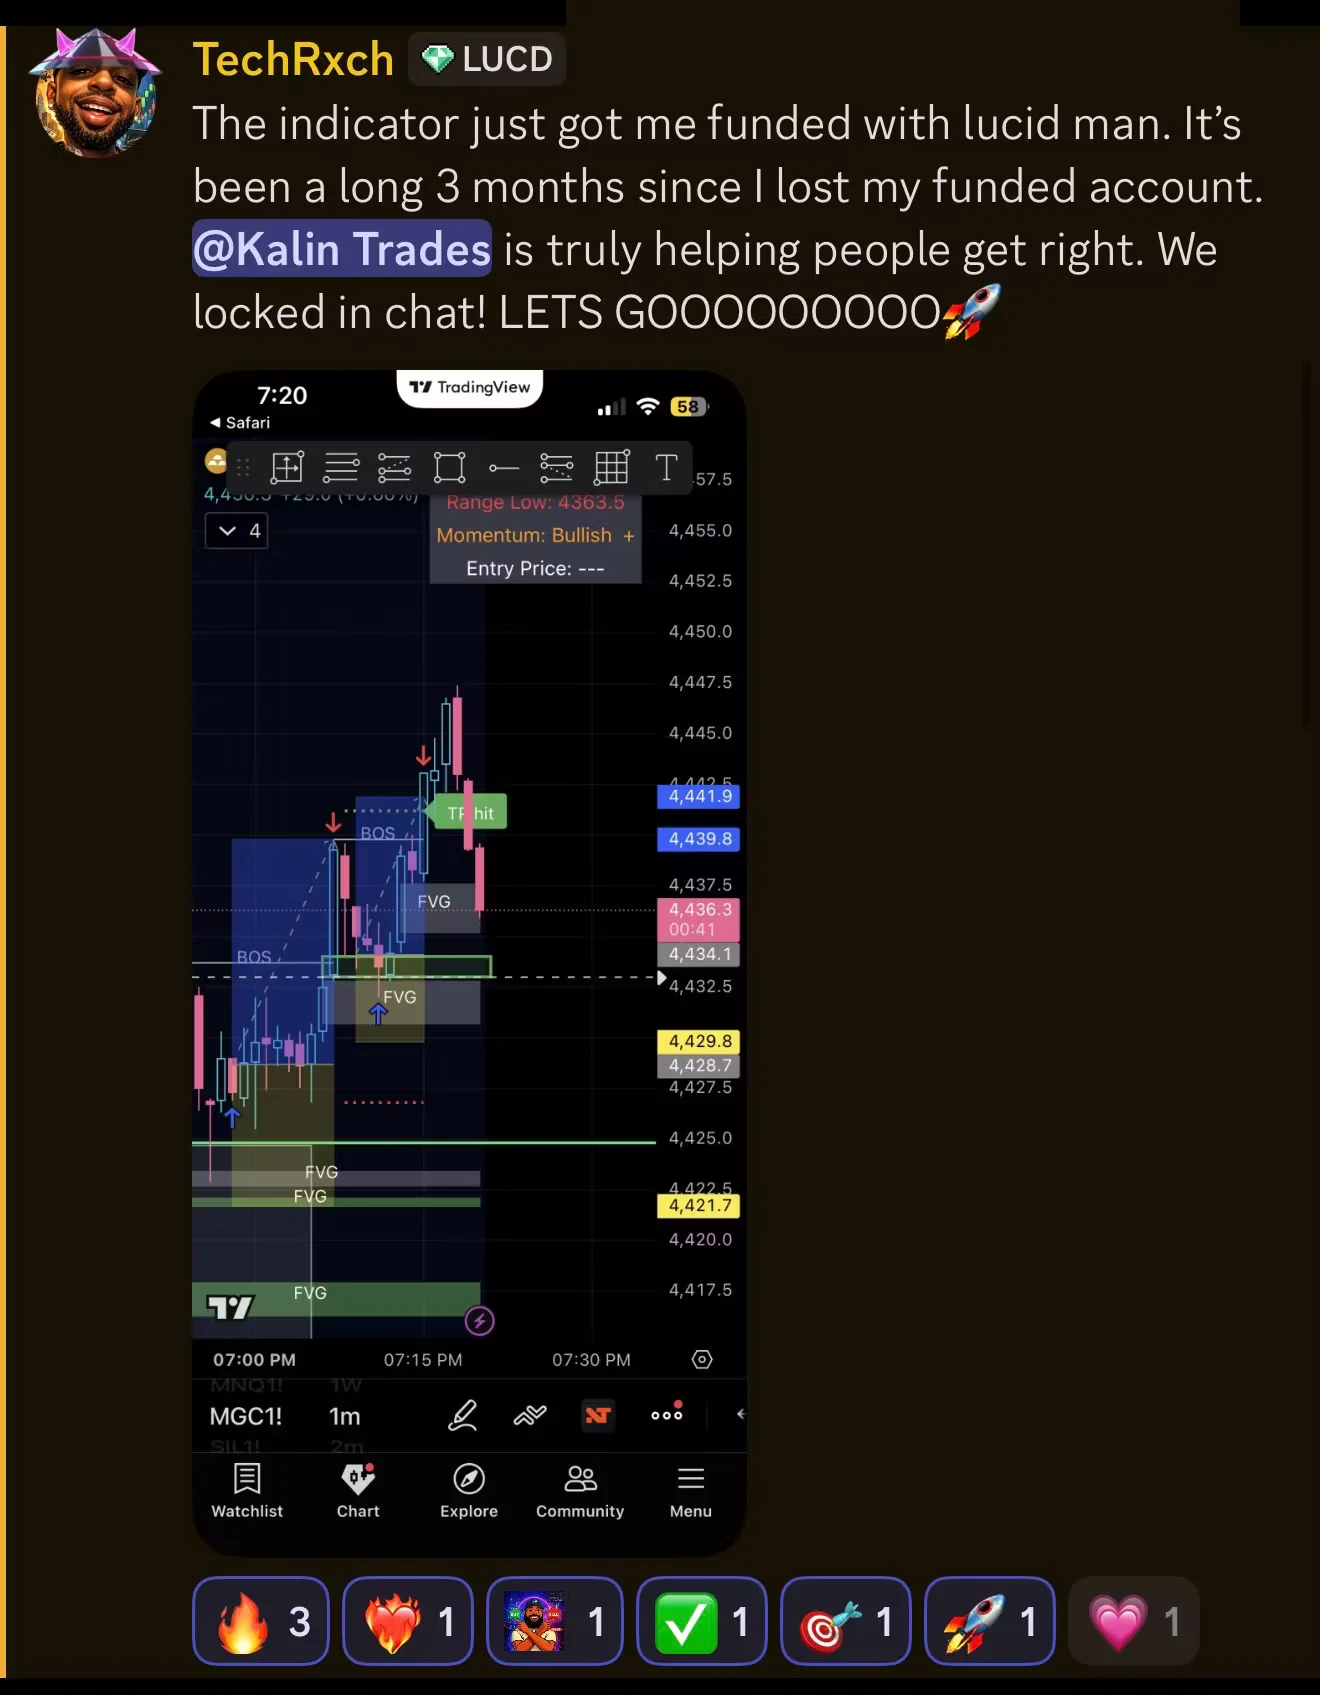

This is not a generic signal tool. It runs the same 8-part checklist I use before every trade and shows a signal only when the required conditions line up. Each signal displays a possible entry price, stop-loss level, and profit target directly on your TradingView chart. It's easy to use, even if you're new to trading.
Screenshots shared by traders using the indicator, from chart examples to their feedback after putting it to work.
It's rarely a strategy problem. It's what happens in the ten seconds before you click buy.
The move looks like it's starting, so you jump in before price actually confirms anything. Then it reverses and you're already down.
A different indicator flashes green, so you take the trade. No context. No idea whether the trade idea meets any clear rules.
Price is already moving and you don't want to miss it, so you chase. Chasing is how good accounts turn into small accounts.
Trend, structure, momentum, volume. Trying to check all of it in your head, fast, while the candle is still moving. That's where mistakes live.
I made every one of those mistakes myself. I entered early, chased moves, and second-guessed trade ideas that were actually valid.
A few years ago I went back through every trade I'd ever logged, the winners and the losers, and looked for a pattern.
The winners weren't random. Every single one had the same handful of things lined up first. Trend direction. A clean structure break. Price sitting at a level that mattered. Momentum actually behind it, not against it.
I wasn't relying on luck. I was running a checklist without realizing it, and my strongest trades appeared when every item on that list was checked.
Once I saw that, I couldn't unsee it. I was repeating the exact same analysis, chart after chart, day after day. So I started asking a different question: what if I didn't have to do it manually anymore?
This isn't meant to replace what you know about trading. It's meant to run the process you already believe in, consistently, without emotion getting in the way.
It checks eight market conditions before showing a trade idea. These include the time of day, the market's larger direction, possible price traps, a confirmed change in direction, useful price zones, and the strength of the move.
You do not need to know these trading terms yet. Each check is explained in plain English below, and the indicator performs the analysis for you.
A signal is a trade idea shown on your chart. Before one appears, the indicator checks the conditions below in order.
The indicator looks for trades during the busiest parts of the Asian, London, and New York morning sessions. Busier periods usually have more activity, so the indicator stays quiet when the market is slow.
It uses the 1-hour chart to decide the larger direction of the market. A long signal means a possible buy, and a short signal means a possible sell. Buy signals appear only when the larger direction is up, and sell signals appear only when it is down.
It watches for price to move briefly above a recent high or below a recent low, then quickly return. Traders call this a liquidity sweep. It can show that the first move was a trap rather than the start of a lasting move.
After the possible trap, price must move strongly past a recent turning point. This is called a break of structure. The indicator uses it as evidence that price may truly be changing direction.
A fast move can leave an area where very little trading happened. Traders call this a fair value gap. The indicator shades that area because price may return to it before continuing.
The indicator marks the final candle that moved against the new direction before the strong move began. Traders call this an order block. The shaded box helps you see where that move started.
This optional check compares two markets that often move together. If one reaches a new high or low while the other does not, the current move may be losing strength. This setting is off by default.
The final check measures how strongly the confirmation candle moved. The candle must close beyond 79% of its measured range, which helps filter out weak direction changes.
Now that you've seen the checklist, here's what it actually changes about the way you trade.
No separate dashboard to check. No second screen. It's all sitting on the chart you're already looking at.
When a signal appears, three lines are drawn on your chart: a blue entry showing the suggested trade price, a red stop loss showing where to exit if the trade moves against you, and a green profit target showing where to take profit.
They don't move and they don't disappear. They stay exactly where they were drawn until the trade actually resolves.
A panel in the top-right corner of your chart shows each check with a tick or an X. A live count shows how many conditions are ready.
After a trade begins, the panel shows the entry, stop loss, profit target, and result in R. One R means the amount placed at risk on that trade.
A dotted line marks where price briefly moved beyond a recent high or low and then returned.
Dashed lines mark the recent turning point that price moved past with a strong candle.
Green and red boxes mark areas where price moved so quickly that little trading happened in between. Green means the move was upward, while red means it was downward.
Blue and orange boxes show where a strong upward or downward move began. Blue marks a possible buy zone, while orange marks a possible sell zone.
The indicator scans for signals during the active Asian, London, and New York morning trading periods.
After price moves far enough in your favor, the stop-loss line can move to your entry price. This is called break even because the planned exit is moved close to where the trade began.
Every label and line above can trigger an alert on desktop, mobile, email, or SMS through TradingView, so you can step away from the chart and still be notified when a trade idea is ready.
Appears when all 8 required checks confirm a possible buy trade. The alert includes the entry price, stop loss, and profit target.
Appears when all 8 required checks confirm a possible sell trade, so you do not have to keep refreshing the chart.
Lets you know the moment your target is reached, so you're not sitting there wondering if it's still running.
Tells you right away if a trade didn't work out, so you can close the laptop instead of watching it play out live.
An early notice that price briefly moved below a recent low and could reverse upward before the complete signal confirms.
An early notice that price briefly moved above a recent high and could reverse downward.
With the alerts doing the watching, here's what that actually gives you back.
With all of that said, let's be straight about what this actually does. No indicator wins every trade. Anyone who tells you otherwise is selling something that doesn't exist.
Losses are part of trading. They always will be. What this actually does is help you follow a better process, more consistently, so the trades you do take are the ones worth taking.
Built to help you trade better, not to promise the impossibleWith realistic expectations set, here's what a normal trading session can look like. The difference is not a promised win rate. It's how much of the guesswork disappears before you click anything.
Preview testimonials showing the type of customer feedback to feature here.
"I used to take three or four trades a day off pure impulse. Now I wait for the checklist to actually confirm. I take maybe one, but it's a much better trade."
"The biggest change for me isn't the signals themselves, it's that I stopped overtrading. My charts are cleaner and my head is clearer when I trade now."
"I've bought a lot of indicators. This is the first one that actually made me more disciplined instead of just giving me more signals to chase."
"I like that it makes me wait for confirmation instead of reacting to every candle. The entry, stop, and target are clear before I decide whether the trade fits me."
"The alerts changed my routine. I can step away from the screen and come back when the full setup is there instead of staring at charts for hours."
"Seeing each checklist factor on the chart helped me understand why a setup qualified. It feels more transparent than a signal that simply says buy or sell."
No monthly subscription. Pay once and put the full 8-part trading framework to work on your TradingView chart.
One-time fee. TradingView account required.
No. Traders call that repainting. Once the Entry, Stop Loss, and Take Profit lines are drawn, they remain fixed until the trade reaches the profit target or stop loss.
It's built around price structure and momentum. It is designed for Forex, Gold, indices, and major crypto pairs.
It's designed for the 1-minute chart. The same checklist can also be used on other intraday timeframes, which means charts used for trades opened and closed within the same day.
Yes. It's designed so you don't need years of chart reading experience to understand what it's showing you.
No. The indicator checks concepts such as liquidity sweeps, fair value gaps, and order blocks for you. The chart labels and dashboard show what has been confirmed in plain language.
No, only one trade open at a time. After it closes, every factor resets and a short cooldown runs before the next signal, so you're never stacking trades or getting rapid-fire entries.
Yes. Built-in alerts can notify you about possible buy and sell entries, profit targets, stop losses, and possible price traps, so you do not have to watch the chart all day.
Yes, Gold is one of the more popular markets among traders using this system.
Yes, it works across major and minor Forex pairs.
Yes, it works on major crypto pairs with enough liquidity for clean structure.
Yes, it's used regularly on indices like US30, NAS100, and similar instruments.
After checkout, you'll get an email with setup instructions and a link to activate the indicator on your TradingView account.
Same checklist I run before every trade I take. Now it runs itself.
Access the Indicator